
Industrial companies are becoming increasingly connected, implementing more advanced processes and more efficient machinery that generate an overwhelming amount of information. This data overload can become an obstacle, limiting efficiency and slowing growth if there is no management framework in place to translate data into decisions. According to Seagate's ‘Rethink Data’ report, 68% of the data generated by companies goes unused. This shows the need for many companies to have an optimization plan at the operational level.
The true advantage does not lie in the sheer volume of data, but in how it is managed, analyzed, and effectively visualized. Below, we explain the role data plays in the transition from a “blind” factory to an “intelligent” factory.
Data Management: The Starting Point for Turning Information into Value
Data management is a fundamental process that allows industrial companies to organize, store, and use information efficiently in order to extract its maximum value.
In the era of Industry 4.0, data is often compared to oil because of its strategic importance. However, poor management can turn it into disconnected silos, greatly limiting its impact. Data management systems—such as traditional databases, data lakes, Big Data platforms, and cloud solutions—are essential tools that help industrial companies overcome common challenges like incomplete data or lack of system integration.
One of the key concepts within data management is Big Data, which enables the processing of large volumes of information in real time, the identification of production process patterns, and the anticipation of failures. To unlock its full potential, however, Big Data must be complemented with analytics, which transforms raw data into actionable insights.
With solutions like TOKII, companies can integrate these technologies into a single platform that combines management, analytics, and advanced visualization. For example, a company can apply prescriptive analytics to adjust production lines and reduce operating costs, using predictive analytics to identify patterns that support decision-making.
Data Analytics: Turning Data into Information
Data analytics is the crucial step that transforms information into actionable knowledge for optimizing industrial operations. Analytics is typically divided into four types: descriptive (what happened), diagnostic (why it happened), predictive (what will happen), and prescriptive (what to do). Each type helps organizations understand the past and present, forecast the future, and define more effective strategies.
Descriptive Analytics: Collects and analyzes historical data to understand industrial process behavior and identify patterns.
Diagnostic Analytics: Explores the causes of problems or outcomes to propose data-driven solutions.
Predictive Analytics: Uses historical data to forecast future scenarios, allowing errors to be anticipated and preventive measures implemented.
Prescriptive Analytics: Combines internal and external historical data to recommend specific actions that optimize industrial processes.
To implement effective analytics, companies need tools that can efficiently collect, process, and analyze data.
With TOKII, factories can integrate the capabilities of systems such as SCADA, IoT platforms, and analytics software into a single solution. TOKII not only replicates physical processes virtually, but also allows simulation of scenarios, real-time predictions, and recommendations to optimize operations.
Business Intelligence (BI): From Data to Decisions
Once data has been analyzed, the next step is to transform insights into strategic decisions. This is where Business Intelligence (BI) comes in.
Business Intelligence refers to the set of tools, technologies, and strategies organizations use to collect, process, and analyze data in order to make better-informed decisions. BI helps businesses understand what happened, why it happened, and, most importantly, what actions to take to improve future performance.
For example, TOKII leverages Big Data to centralize, analyze, and visualize large volumes of information in real time, connecting data from diverse sources. This enables truly data-driven decision-making through digital twins.
Additionally, integration with immersive technologies such as augmented reality (AR) and virtual reality (VR) further enhances data comprehension, ensuring that each decision aligns with business objectives.
Data Visualization
Data visualization is a technique that transforms complex information into intuitive graphical representations, making interpretation and informed decision-making easier.
Our brain processes visual information more quickly and effectively, which explains why graphical representations have always been fundamental in transmitting knowledge throughout human history.
Images can communicate universally what words often cannot, which is why visualization has become an indispensable tool for organizations that handle large volumes of data. Visualization allows immediate access to key insights, revealing patterns, trends, and relationships that might otherwise go unnoticed in traditional data formats. In the Big Data era, this technique has become essential for extracting value from information and guiding effective business strategies.
Types of Data Visualizations
As technology advances, visualization techniques have expanded beyond traditional graphs, ranging from simple 2D representations to complex 3D models and digital twins.
2D visualizations: These are the most traditional, often presented in dashboards and reports. They clearly and concisely convey data, facilitating the understanding of trends, comparisons, and distributions. Common examples include bar charts, line charts, pie charts, heatmaps, treemaps, and scatter plots. They are ideal for static data or visual summaries of complex information.


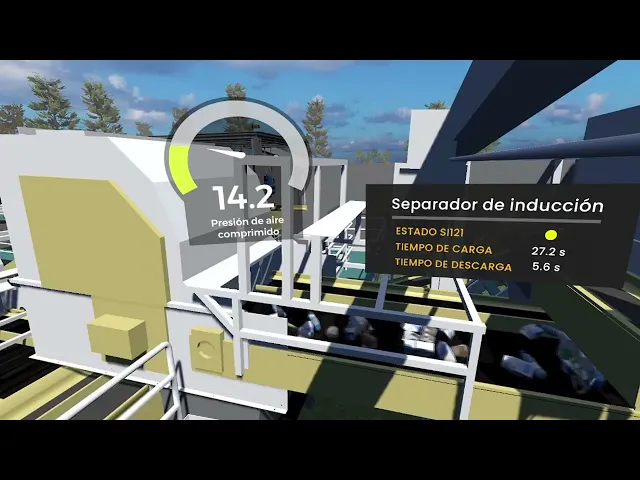
3D visualizations, also known as Visual Analytics, take data representation to the next level by allowing interaction with data in three dimensions. They are particularly useful when data has a spatial component or when a more immersive experience is needed to understand dynamic processes.


Digital twins enable advanced analyses and real-time visualization of results directly on machines as they operate. This type of visualization not only improves data understanding but also enhances the ability to respond to problems or opportunities.
Unlike the previous point, data visualization through a digital twin like TOKII provides an immersive way to understand data analysis. It allows you to simulate and monitor your factory’s operations while viewing data in real time, thereby facilitating decision-making.
The Role of AI and Machine Learning in Data Analysis and Interpretation
Artificial Intelligence (AI) and Machine Learning (ML) are radically transforming how industrial companies analyze and interpret their data. Their true strength lies not only in processing historical data, but also in identifying complex patterns, forecasting future outcomes, and adapting to new circumstances.
At IMMERSIA, we are applying these technologies across multiple projects. One of our most innovative solutions is the no-code ML module, designed to let companies apply machine learning algorithms without requiring advanced technical knowledge.
These companies that use our digital twin platform TOKII are capable of generating virtual environments where they can train and test algorithms without interrupting daily activities, optimize resource consumption, or take preventive actions.
By combining AI and ML with advanced data management and visualization tools, factories can not only boost operational efficiency but also shift from reactive to proactive decision-making.
Examples of Industrial Digital Twins
Construction and Engineering
ACCIONA sought greater visibility into the processes at its recycling plant in Palencia. Traditional monitoring made effective data interpretation difficult and limited its ability to optimize processes and make informed decisions.
TOKII was implemented with a high level of detail and realistic animations to improve visualization and understanding of processes. By connecting with existing systems like SCADA, ACCIONA could monitor data in an immersive environment and see the plant operating in real time.
As a result, ACCIONA achieved precise visualization of its plant and recycling processes, improved operational efficiency, and accelerated decision-making through immersive KPI monitoring. Additionally, team collaboration improved significantly as data could be handled, shared, and understood more effectively.
Machine-Tool Sector
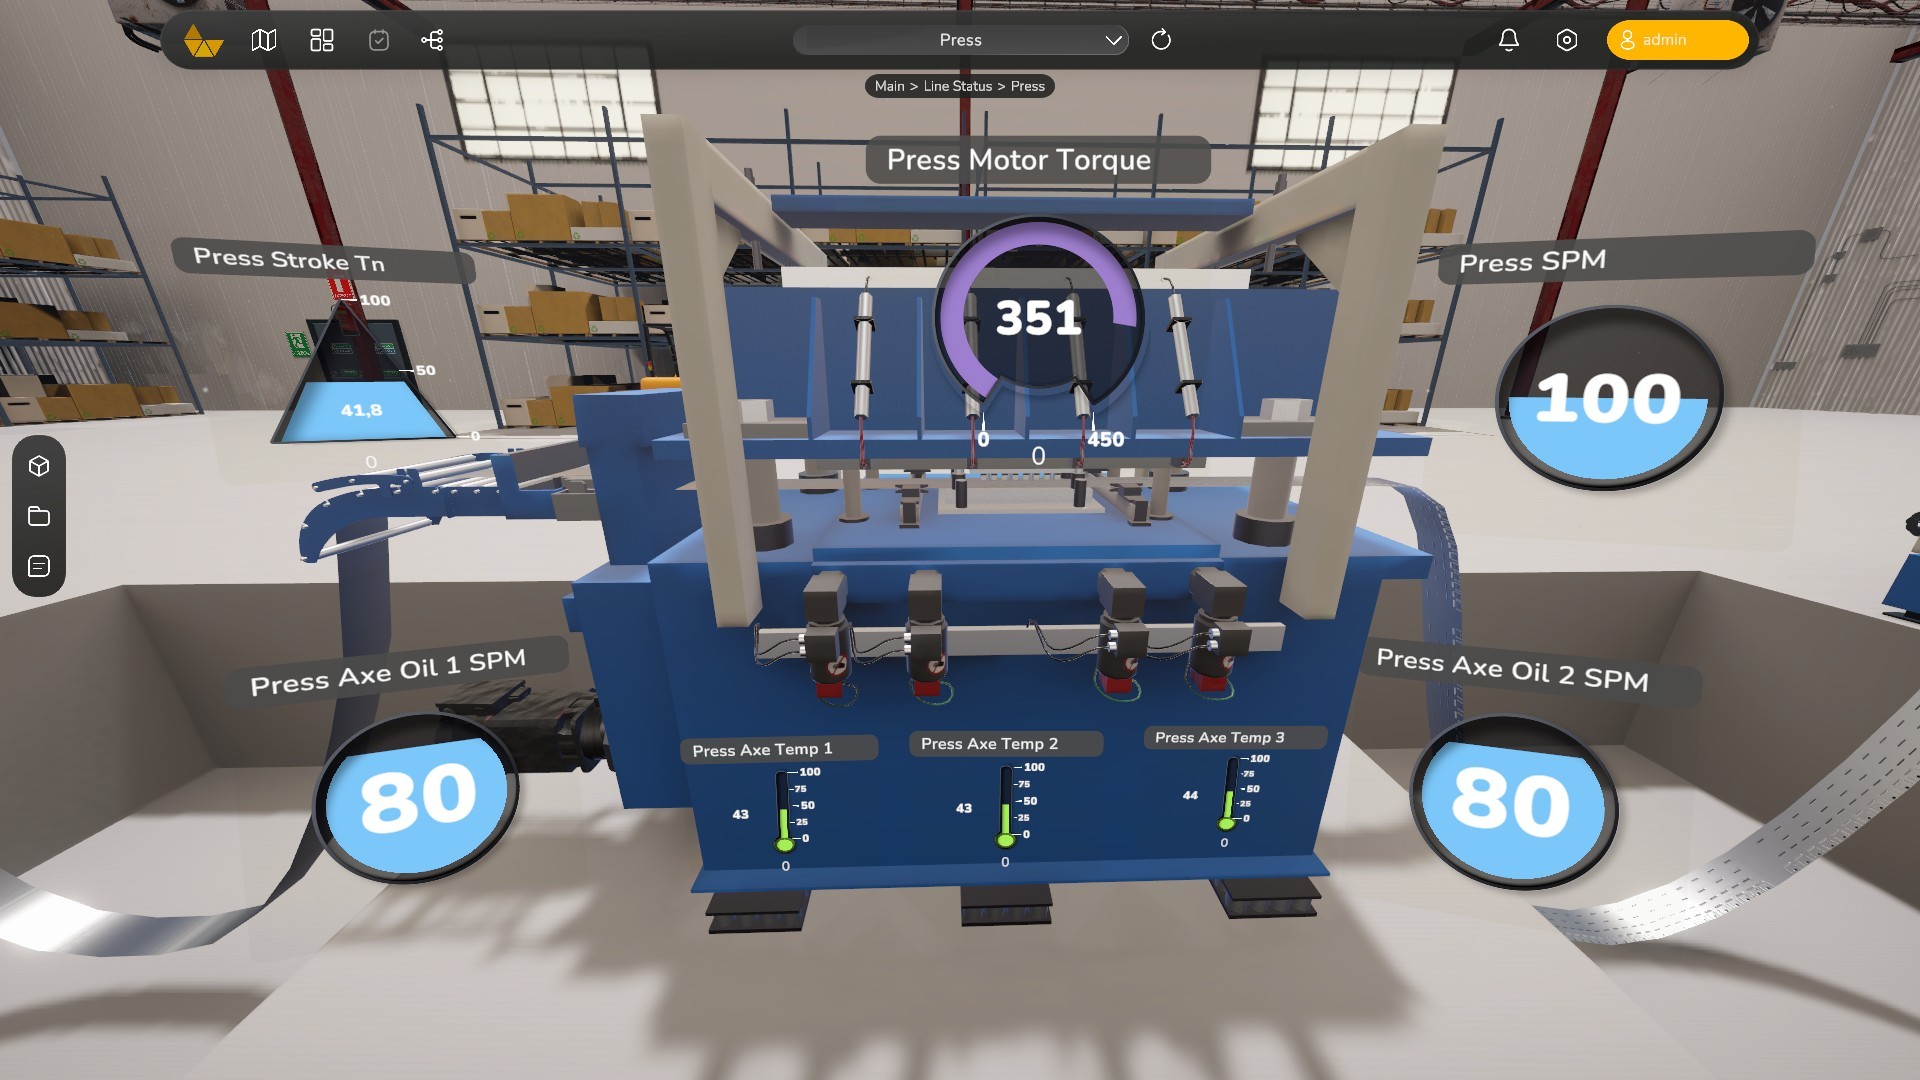
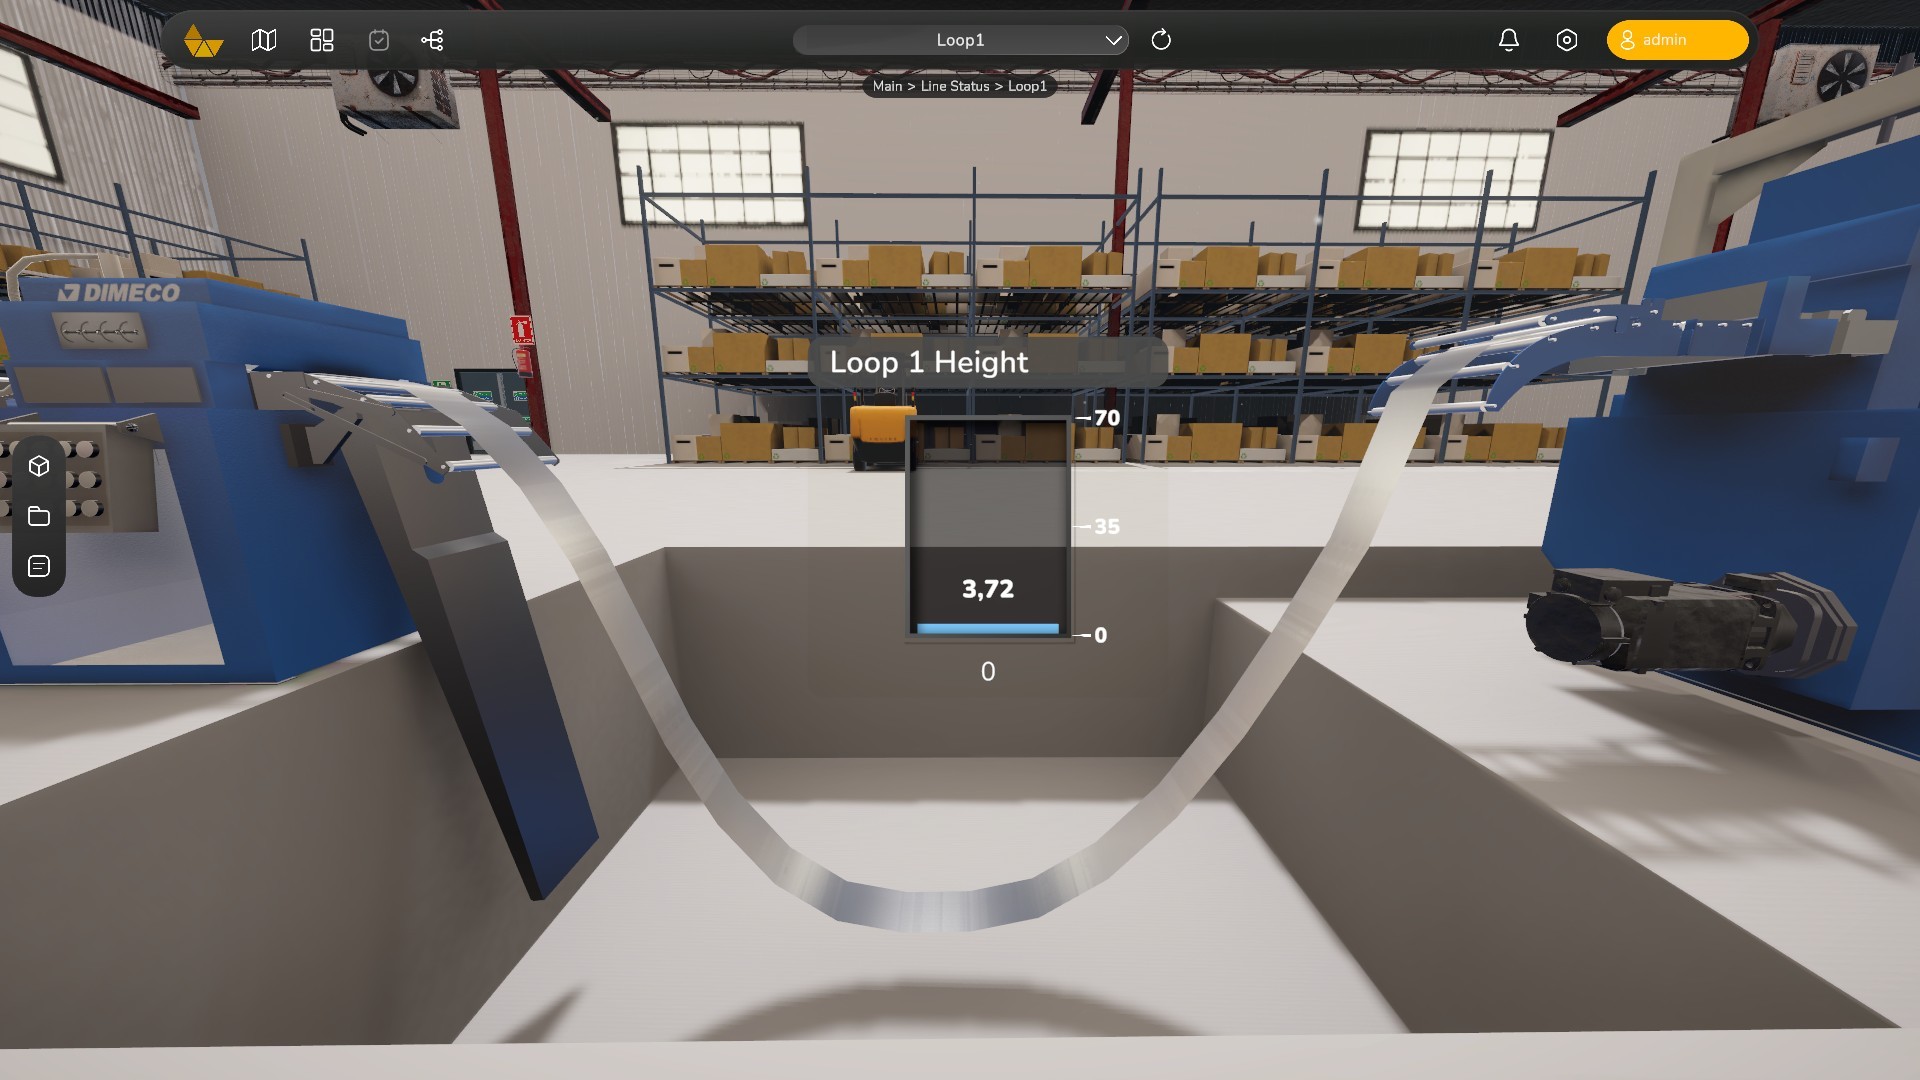
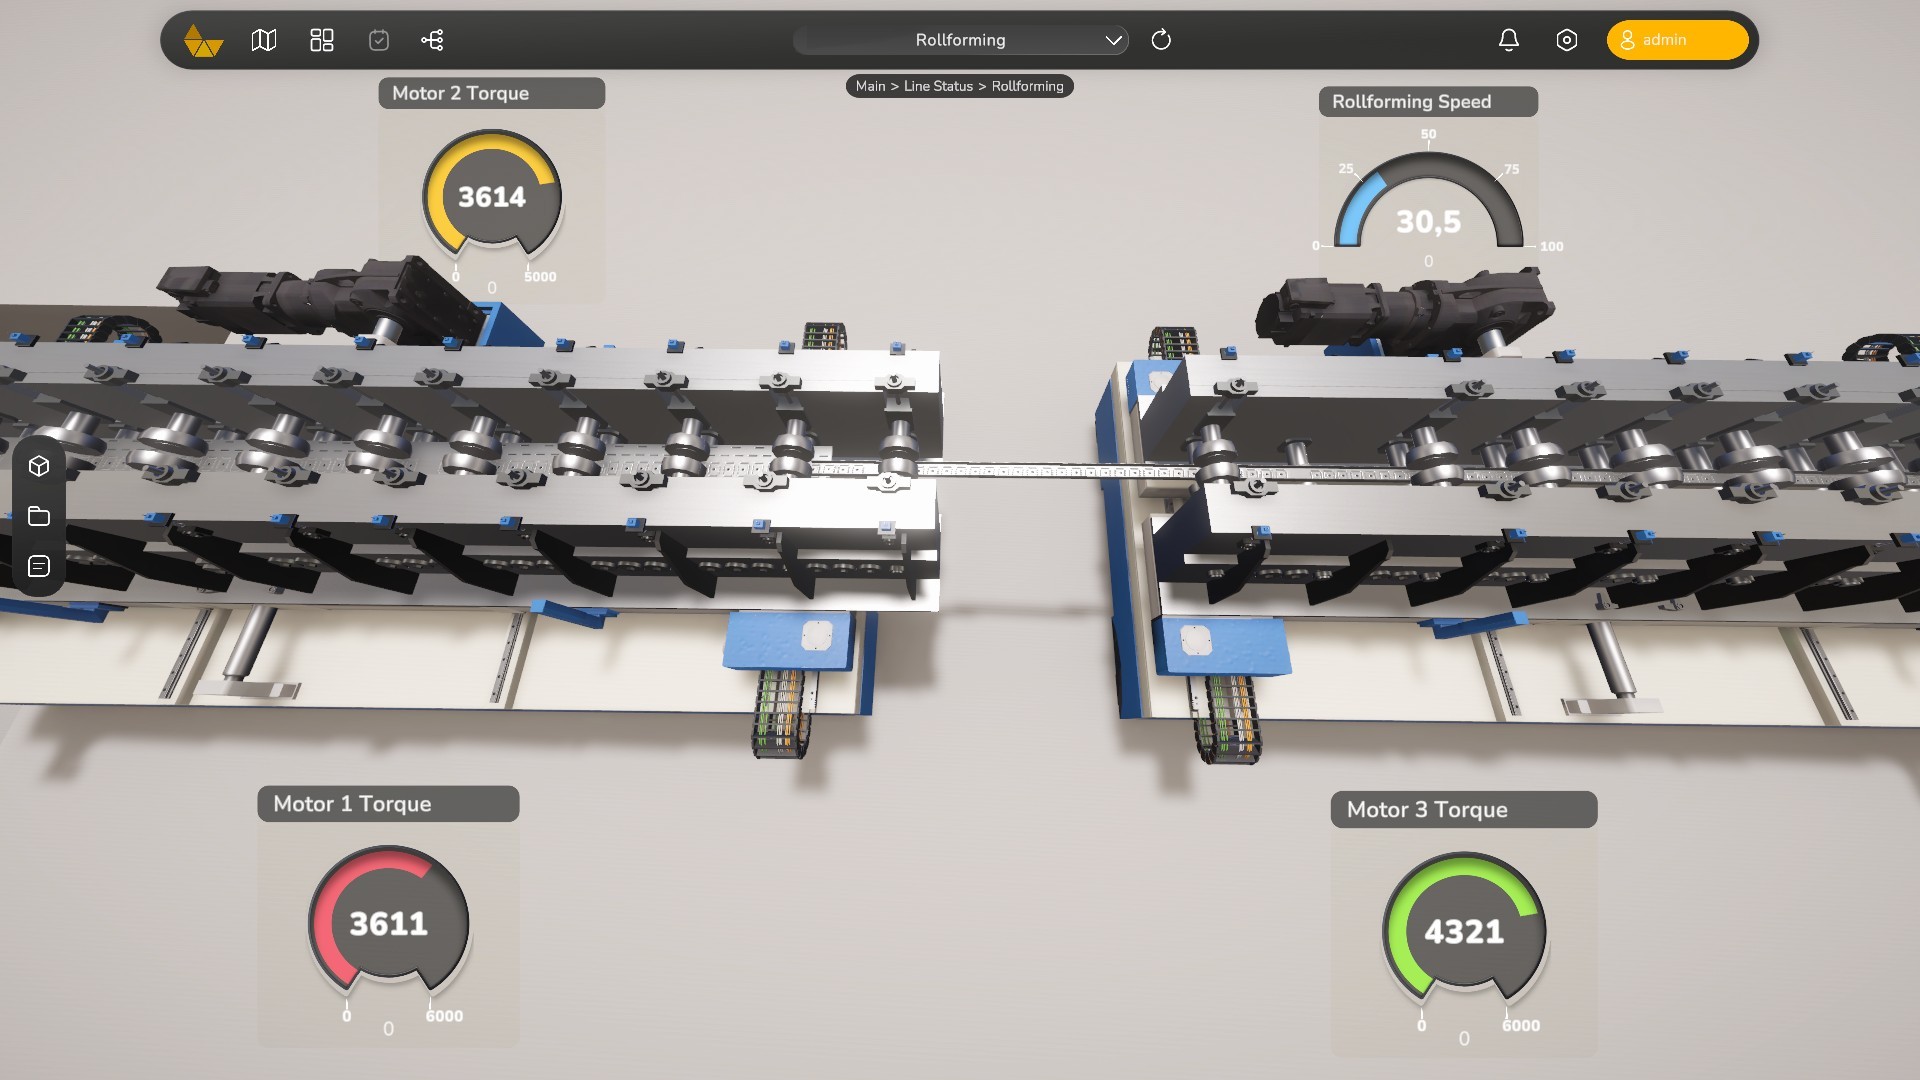
DIMECO needed an advanced graphical representation of its HMI (Human-Machine Interface) for its production lines, as well as the ability to calculate loop size and production speed.
To address these needs, TOKII was adapted and customized for DIMECO, integrating advanced visualization and a built-in simulator. Equipped with technologies like AI and ML, the simulator allowed them to calculate optimal distances and determine loop sizes between machines while adapting to varying production speeds.
With TOKII, DIMECO optimized production line configuration through accurate simulations, reduced costs, and avoided unnecessary infrastructure work. Advanced visualizations also enabled real-time production monitoring, improving both productivity and customer experience.
Data Analytics Tools for the Industrial Sector
Faced with the challenge of managing the growing volume of data generated from multiple sources, companies need to carefully select the right tools. Within the ecosystem of Big Data and Business Intelligence solutions, there are both specialized software products and comprehensive platforms that offer a wide range of features.
If you are looking for a comprehensive platform designed specifically for the industrial sector, TOKII provides everything necessary to integrate, analyze, manage, and visualize data. Its combination of digital twins, advanced analytics, and real-time visualization makes it an ideal solution for factories aiming to optimize critical processes such as predictive maintenance and real-time resource management.
By contrast, Tableau, excels in data visualization and the creation of interactive dashboards. However, it may be less effective in environments that require real-time analysis or deep integration with industrial systems such as SCADA or IoT.
In this same category, Power BI, is widely recognized for its ease of use and seamless integration within the Microsoft ecosystem. The drawback, however, is that it is not specifically designed for the industrial sector and can fall short in more advanced industrial scenarios.
Finally, Qlik stands out for its ability to integrate real-time data and support detailed analyses in complex industrial environments. Its steeper learning curve, however, may demand additional resources for training or consulting, which can be a limitation for companies with smaller teams.