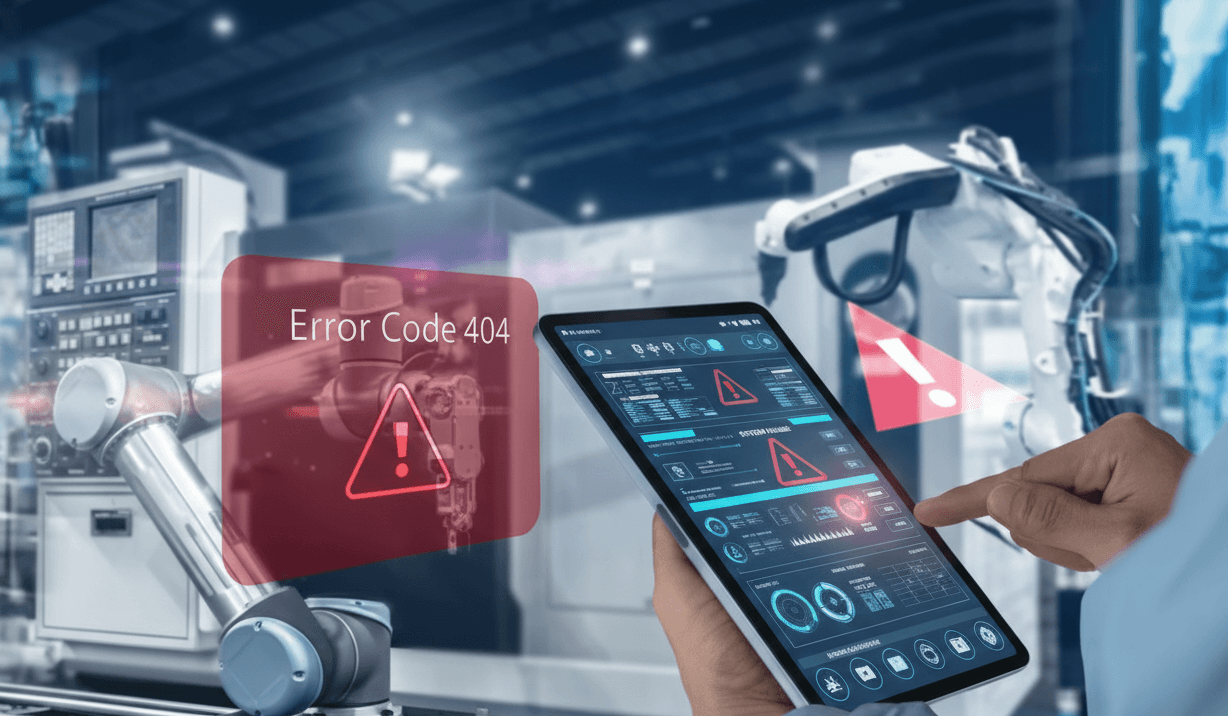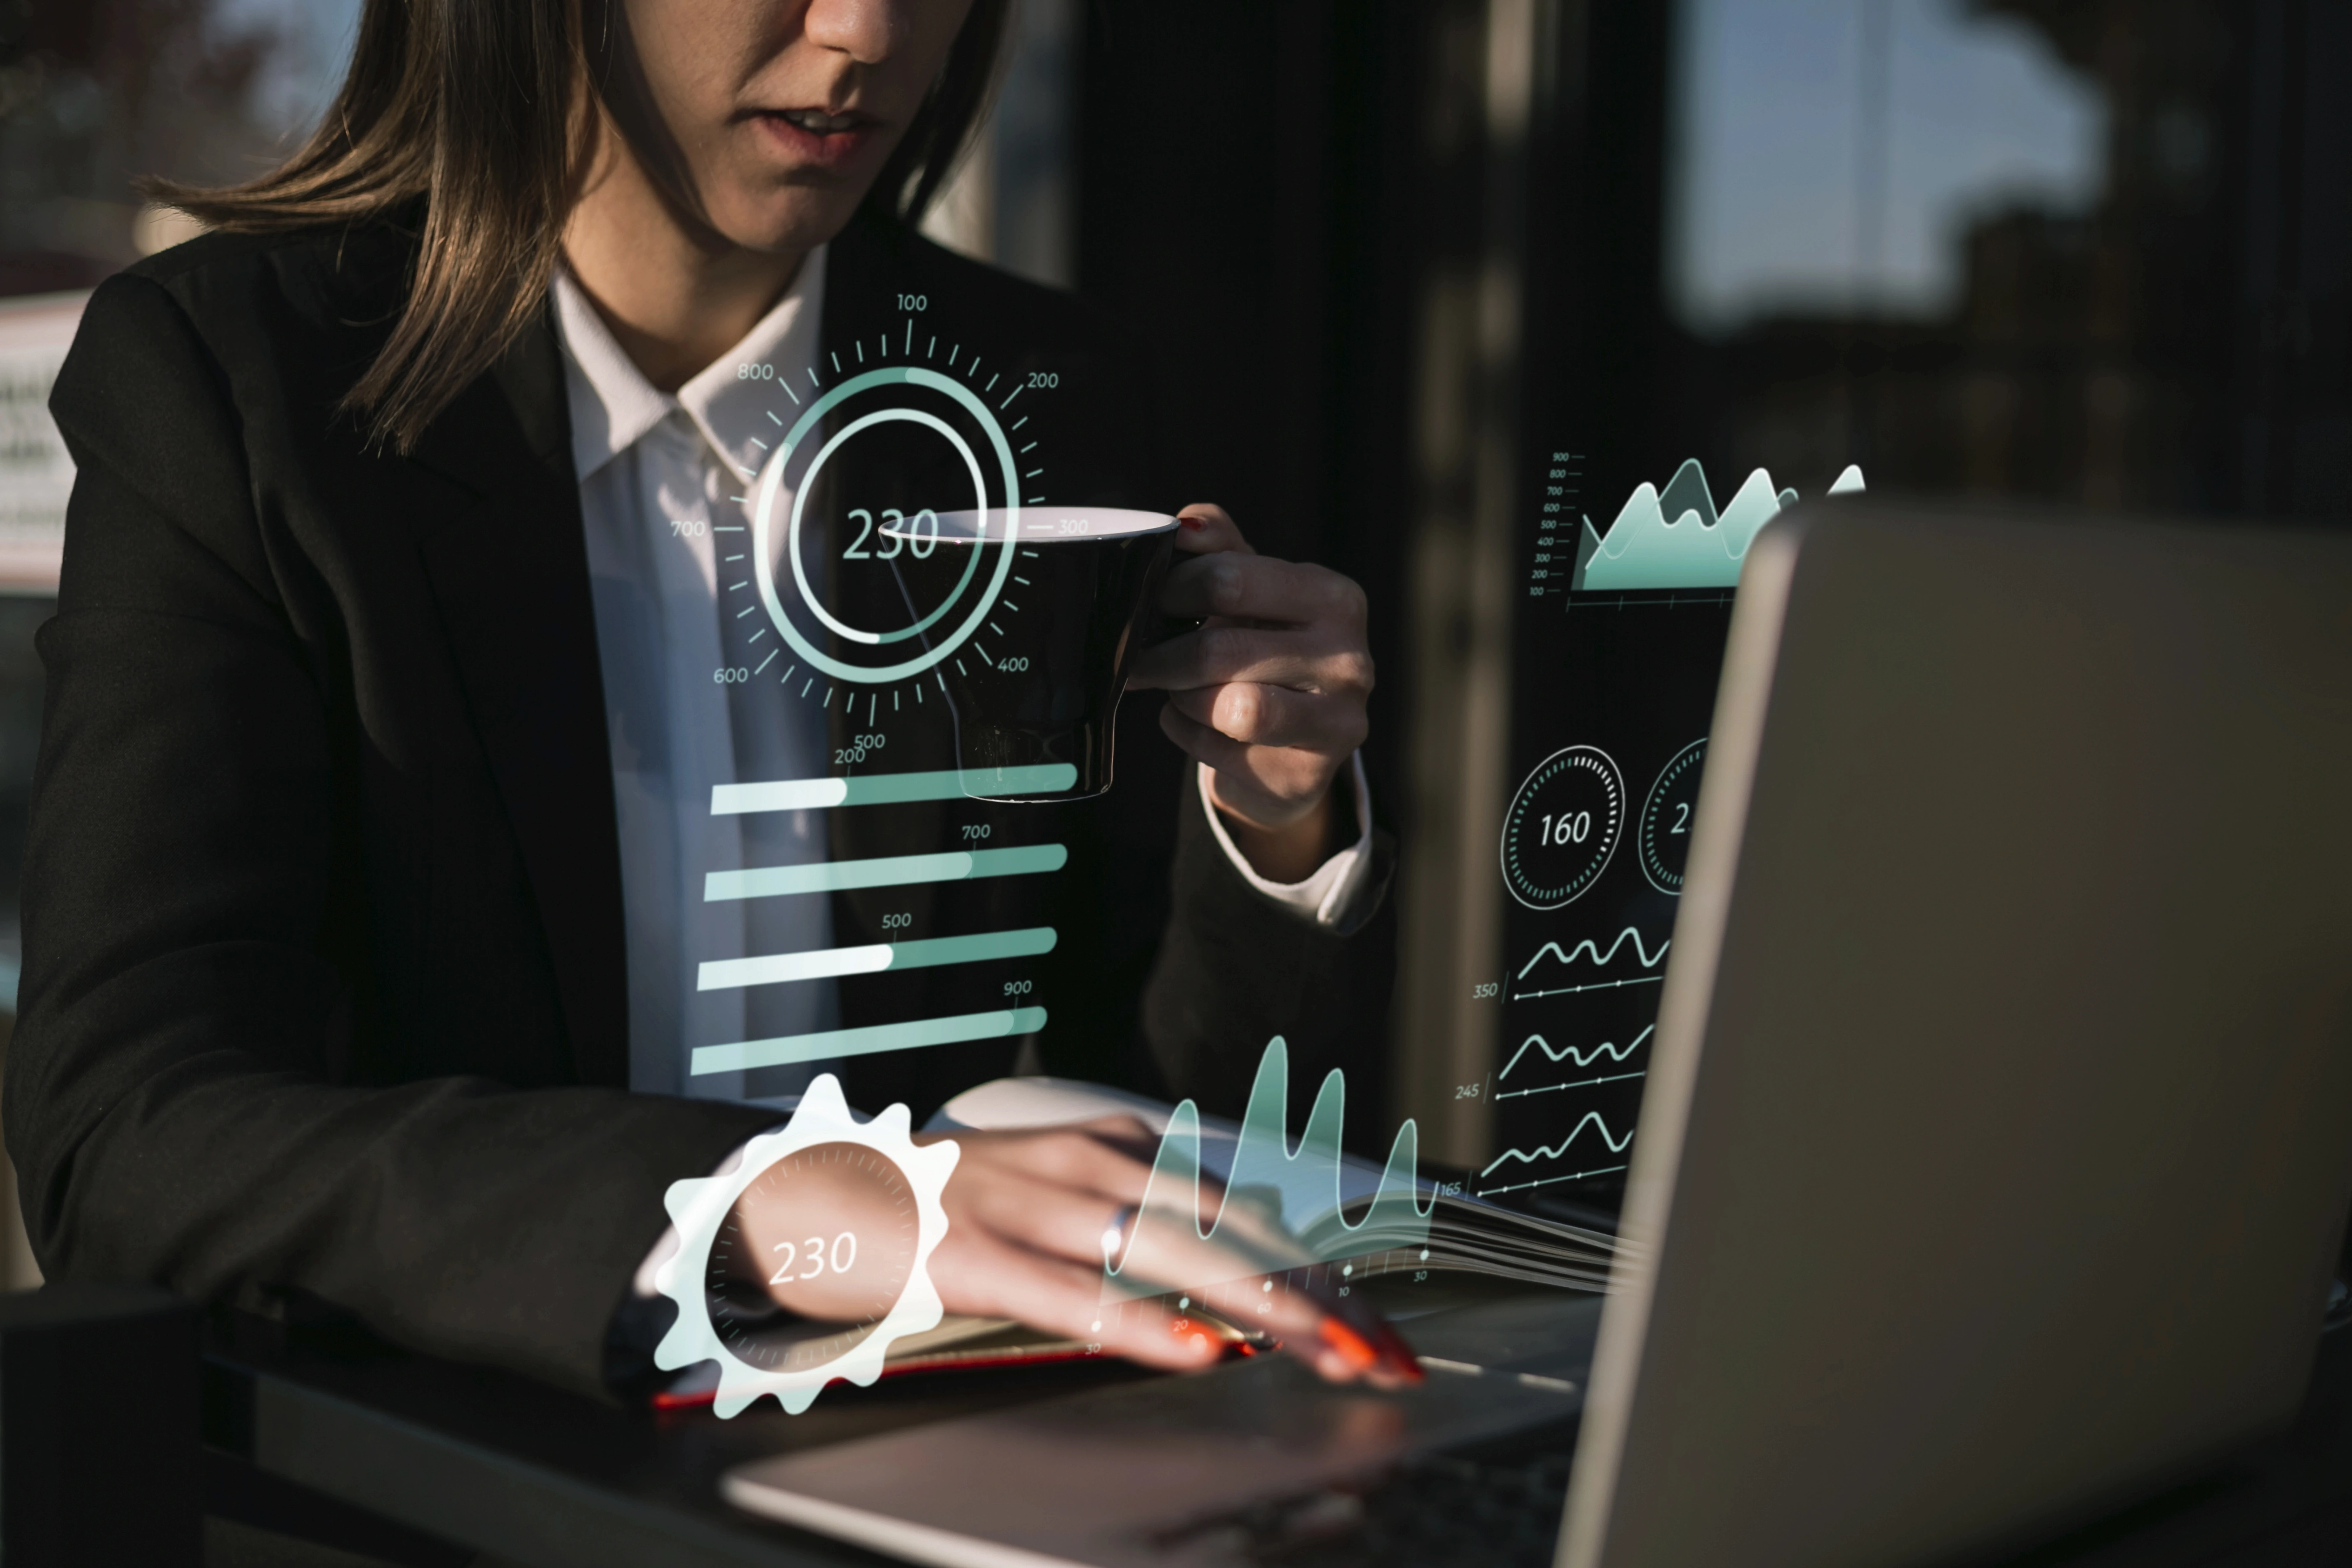

The era of Industry 4.0 has presented a major digitalization challenge for companies, where making fast, informed decisions has become a key factor for success. In this context, visual analytics has emerged as an essential tool that enables organizations to transform large volumes of data into valuable insights, helping improve processes, optimize resources, and anticipate problems before they occur.
What is Visual Analytics?
Visual analytics refers to the graphical representation of complex data through interactive visual interfaces to facilitate understanding and analysis. In today’s industrial landscape, where massive amounts of data are generated from various sources, such as the Internet of Things (IoT), big data platforms, and automated systems. The ability to interpret that data efficiently is critical. These visualizations not only improve communication but also enhance the cognitive processes required for a deeper understanding of the information.

Visual analytics is particularly effective for conveying information clearly to all team members, especially those who are less technical and may not be familiar with complex tools like SCADA or MES. It is an ideal way to provide an at-a-glance view of plant status and present well-informed conclusions.
The integration of 3D visualizations and digital twins is enabling companies to simulate and anticipate the behavior of their systems and processes, taking operational efficiency to new levels.
Visualization strategies
At IMMERSIA, we offer a variety of interface options tailored to different industries and the specific needs of each client:
Interactive Dashboards: | Custom control panels that allow users to monitor key metrics in real time. These dashboards can also include 3D visualizations, adding depth and context to the data presented. |
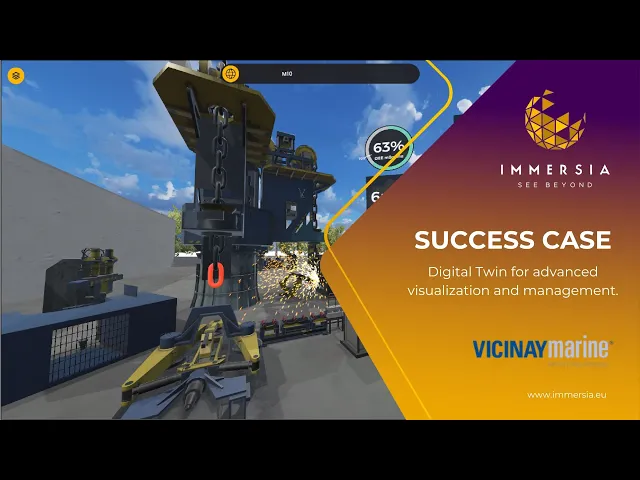
Digital Twin: | A digital twin is a detailed virtual representation of an object, system, or infrastructure, integrating real-time data through sensors and advanced technologies. By combining IoT, artificial intelligence (AI), and machine learning, it enables simulation, prediction, and optimization of the physical asset's behavior throughout its lifecycle. Our platform TOKII, based on digital twin technology, allows users to create virtual replicas of industrial plants and navigate them in 3D. This supports detailed monitoring and predictive analysis in an immersive visual environment. |
Immersive data visualization
The human brain is naturally wired to process 3D visualizations, which makes interactive experiences more intuitive and engaging. Immersive data visualization leverages this natural advantage by combining advanced visualization technologies such as virtual reality (VR), augmented reality (AR), and digital twins to create interactive environments where data comes to life. These tools immerse users in a three-dimensional space, allowing them to explore information in a more intuitive and engaging way.
TOKII is an intelligent and user-friendly platform that offers flexible connectivity and control over multiple data sources, both cloud-based and on-premise, thanks to its compatibility with a wide range of protocols. To better understand its capabilities, we encourage you to watch this short video that highlights just some of the many possibilities it offers.
Use cases
Vicinay Marine implemented TOKII to monitor machine manufacturing data, achieving a unified and integrated view with visual intelligence functionalities. You can read the full success story in the ‘Vicinay Success Case.’
Conclusion
Visual analytics has become a necessity for companies looking to maintain a competitive edge in the Industry 4.0 era. Turning complex data into clear, actionable insights allows businesses to make faster decisions, optimize processes, and stay ahead of potential issues. At IMMERSIA we offer flexible and customized solutions tailored to the needs of each company.
Interested in bringing visual analytics to your business?
If you are considering implementing visual analytics in your company, at IMMERSIA we can help you. Our solutions turn your data into actionable insights, enabling smarter decision-making.
Get in touch with us and discover how we can help you lead in the Industry 4.0 era.