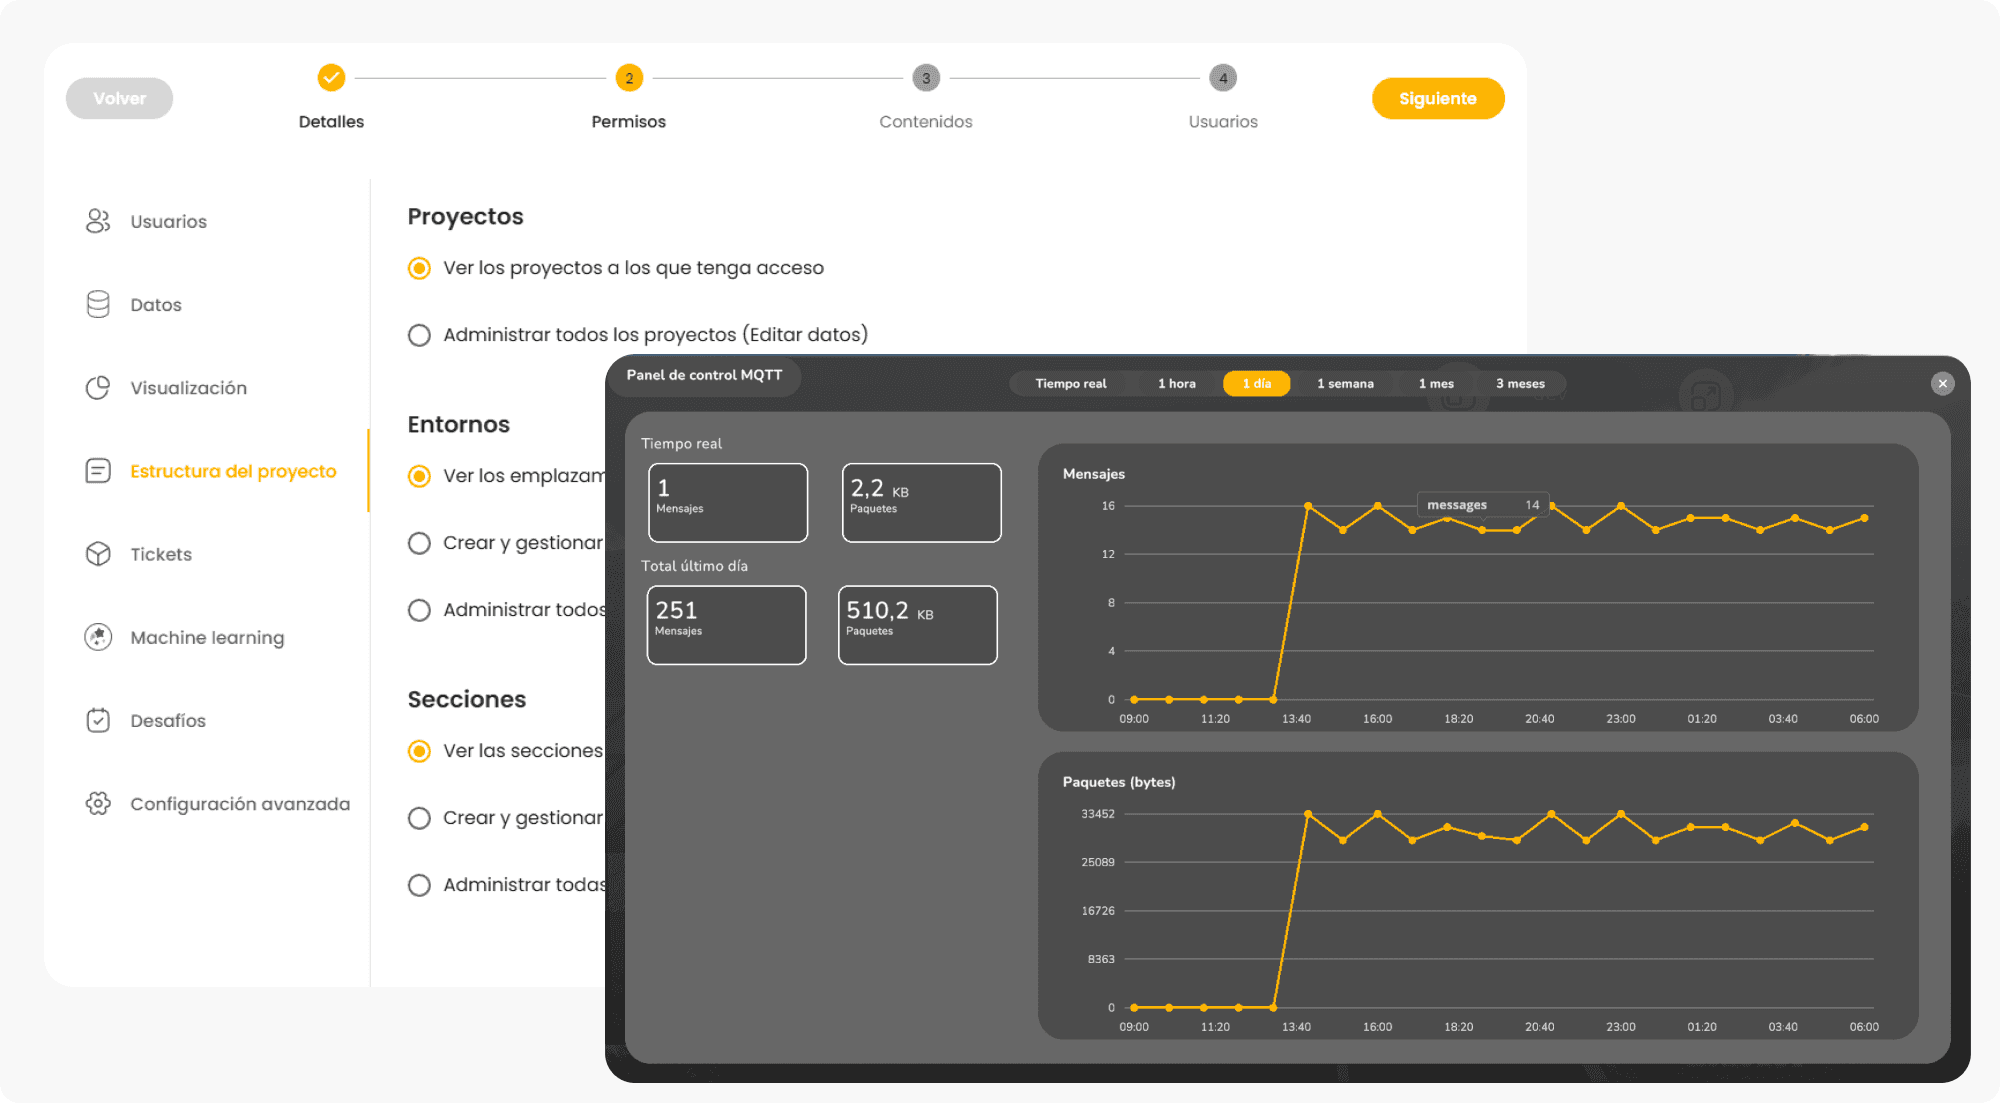
Nuevo Módulo de Permisos — El corazón de TOKII 3.0
El gran protagonista de esta versión es el refactor completo del sistema de permisos, que deja de ser un mecanismo silencioso en segundo plano para convertirse en un pilar funcional y visible del ecosistema TOKII.
Un sistema más claro, más consistente y más predecible
Reescritura total de la lógica interna para que la plataforma responda exactamente según el rol del usuario.
El sistema ya no permite “zonas grises”:
si puedes ver algo, no necesariamente puedes editarlo; si no puedes editarlo, los inputs se bloquean de forma explícita.Desaparecen comportamientos ambiguos donde una pantalla parecía editable pero no lo era realmente.
Se elimina la posibilidad de modificación involuntaria en sites sensibles, asegurando control total en entornos de producción.
Base para auditoría, trazabilidad y escenarios multinivel
Esta reconstrucción deja preparada la estructura para próximas funcionalidades:
Permisos por módulo o por sección
Accesos granulares en dashboards
Perfiles avanzados para operaciones y mantenimiento
Auditoría de edición y cambios
En definitiva, TOKII 3.0 redefine cómo se gobierna un site, elevando la fiabilidad y el control sobre proyectos complejos.
Métricas en tiempo real: nuevo dashboard MQTT
La gran novedad en observabilidad es el dashboard de métricas de MQTT, pensado para entender qué está pasando “por debajo” de los KPIs y flujos de datos con foco en comportamiento real de los canales y estabilidad de la ingestión.
Este dashboard convierte la capa de mensajería en algo visible y auditable, clave para operaciones donde MQTT es el corazón del sistema.
Smart cities que se mueven: animaciones de energía y calidad del aire
La capa visual de smart city se refuerza con animaciones que hacen más intuitivo lo que antes eran solo datos:
Animación de apagado en escenas de smart cities, dando contexto visual a estados de “off”, incidencias o simulaciones de fallo.
Animaciones del suministro de energía, que ayudan a entender flujos, consumo y posibles cortes de forma visual.
Animaciones de calidad del aire, vinculando datos ambientales con una representación viva y fácil de explicar a públicos no técnicos.
Se añade una estación meteorológica en tejados, pensada tanto para retos como para experiencias de monitorización ambiental.
Estas animaciones convierten el gemelo digital en una herramienta más pedagógica y demostrativa.
Visualizaciones más legibles: heatmap, apiladas y tablas
3.0 incorpora un conjunto de pequeños ajustes que, sumados, elevan mucho la legibilidad de los datos:
Heatmap
Corrección del eje X a partir de 10, que mostraba los números de forma incorrecta.
Ajuste del espacio en la leyenda, mejorando el equilibrio entre colores y texto.
Revisión de Value attributes en modo string, asegurando que estados textuales se representen de forma clara.
Gráficas apiladas y Connected Dots
Fix del hover en apiladas, que ahora muestra información coherente al pasar el ratón.
Revisión de colores en apiladas para mantener coherencia visual y semántica.
Corrección del bug en Connected Dots, estabilizando el comportamiento de la visualización.
Ejes y nombres
Mejora en el corte de nombres en los ejes por espacios, sin partir palabras, lo que evita etiquetas ilegibles o rotas.
En hovers de estados, ahora aparece el formato “nombre de dato: valor del dato”, asegurando contexto completo.
Tablas
El KPI tabla ignora etiquetas
<div>dentro de las celdas, evitando ruido visual en datos HTML.Se elimina el label redundante en la tabla cuando no aporta información.
Nueva configuración para reducir el tamaño de la letra, clave en tablas densas.
Fix en KPI marker cuando solo hay una columna en el dataset, evitando comportamientos anómalos en casos límite.
Columnas
Posibilidad de renombrar columnas desde configuración, adaptando la terminología técnica a un lenguaje más cercano al usuario (equipos, instalaciones, etc.).
Resultado: las visualizaciones se leen mejor, se interpretan más rápido y se comportan de forma más consistente.
Tickets: más contexto, más control y mejores errores
El módulo de tickets sigue evolucionando hacia una herramienta operativa central:
En el detalle de un ticket dentro del dashboard, se añade un botón para ir directamente a la sección del ticket en el gemelo, conectando vista analítica con contexto 3D.
Se implementa un control de errores más claro en tickets, evitando mensajes genéricos y facilitando la resolución de incidencias de uso.
Se corrige un comportamiento donde, al hacer click en una alerta, se marcaban todas como leídas: ahora solo se marca la alerta seleccionada.
Se resuelven errores específicos relacionados con tickets y notificaciones TOKII 3D, mejorando la coherencia entre avisos, estados y detalle de incidencia.
Estas mejoras reducen ambigüedades en la operación diaria y facilitan la trazabilidad de cada evento.
Login y permisos: seguridad más transparente
La autenticación y la gestión de permisos reciben una vuelta de tuerca importante:
Rediseño del login de TOKII 3D, con una interfaz más clara y alineada con el lenguaje visual actual.
El sistema de login ahora muestra información en los errores con código asociado, lo que facilita el diagnóstico (problemas de credenciales, certificados, conectividad, etc.).
Se añade lógica de login sin certificados en entornos locales, simplificando el desarrollo y pruebas sin comprometer la seguridad en producción.
TOKII Gabonak inaugura una línea de experiencias temáticas/estacionales, ideal para demos, campañas y activaciones especiales dentro del entorno 3D.
La experiencia final es más predecible: si algo falla, el usuario sabe por qué; si no tiene permiso, la interfaz refleja claramente esa realidad.
Mapas, Mapbox y estructura de secciones
TOKII 3.0 sigue limpiando y ordenando la capa de mapa y su configuración:
En el menú de settings del site se añaden nuevas opciones específicas de Mapbox, centralizando los ajustes cartográficos.
Se elimina
maxpboxEnabledInSitey se revisan los emplazamientos con Addressables para simplificar la configuración y evitar estados intermedios.Se corrige un error en settings de mapa que podía provocar comportamientos incoherentes o bloqueos al configurar la vista.
Se solucionan problemas en el menú de secciones y en Posicionar Sección (cambios de nomenclatura + controles), para que la selección y colocación de secciones se sienta más natural.
Fix de categorías cerradas en el LateralMenu, garantizando que la navegación refleja correctamente qué está disponible y qué no.
El resultado es una gestión de mapa y estructura del site más clara, especialmente para proyectos con muchas secciones y capas.
Entorno 3D y visualizaciones: edición más honesta
La experiencia dentro del gemelo afina detalles importantes:
En la cámara de preview, se ajusta la franja del mensaje "F para hacer focus" para que no interfiera visualmente al colocar elementos.
Al entrar al editor de visualizaciones, ahora se deselecciona el KPI activo para que, al colocarlo, se vea su tamaño realsin heredar escalas extrañas.
Nueva prueba de comportamiento: al editar la posición de una visualización, esta se mueve siempre respecto a la sección (y no respecto a la cámara), haciendo la edición más consistente con la lógica espacial del site.
Se corrigen bugs en botones interactivos de navegación e interactivos de navegación en general, garantizando transiciones fluidas entre vistas.
Esto hace que el entorno 3D sea más fiable a la hora de editar y revisar contenido, reduciendo sorpresas en producción.
Paleta, estructura y pequeños ajustes de interfaz
La versión se cierra con una serie de mejoras de detalle que pulen la experiencia general:
Ajustes de paleta para mantener coherencia entre KPIs, mapas, estados y elementos de interfaz.
Revisión de colores en apiladas, tablas y estados para mejorar contraste y lectura.
En la sección Estructura del configurador, se cambia el sentido de las flechas para que el movimiento entre niveles sea más intuitivo.
Se afinan comportamientos de settings de mapa y otros menús de configuración para evitar bloqueos y estados ambiguos.
Estabilidad interna y correcciones técnicas
Por debajo de la superficie, TOKII 3.0 incluye una limpieza importante de errores:
Corrección de múltiples NullReferenceException (OnMenuObjectsRefresh, ValueNameInputFieldValueChanged, RayGunMode.CreateDotFromRaycast y otras genéricas) que podían romper flujos de trabajo en escenarios concretos.
Fix a un InvalidOperationException: Collection was modified; enumeration operation may not execute, estabilizando loops internos sobre colecciones dinámicas.
Hotfix en el procesado de CSV, evitando fallos silenciosos en la carga de datos.
Todo ello refuerza la estabilidad del sistema y reduce la aparición de fallos difíciles de reproducir.