Mejoras y nuevas funcionalidades
Visualizaciones y KPIs
Rediseño completo de la visualización Lista, ofreciendo mayor claridad, estructura y usabilidad.
Implementación de tooltips en barras, columnas objetivo y círculos conectados por MQTT.
Nueva configuración de Dotplot para Dataset y MQTT, incluyendo ajuste del tamaño de las bolas.
La visualización asociada a un hotspot ahora se renderiza siempre por delante de los demás.
Feedback en el menú de visualizaciones al activar el modo edición.
Mapas e interacción
Rediseño de marcadores del mapa.
Información en hover de elementos del mapa.
Botón de reseteado de zoom en la vista del mapa.
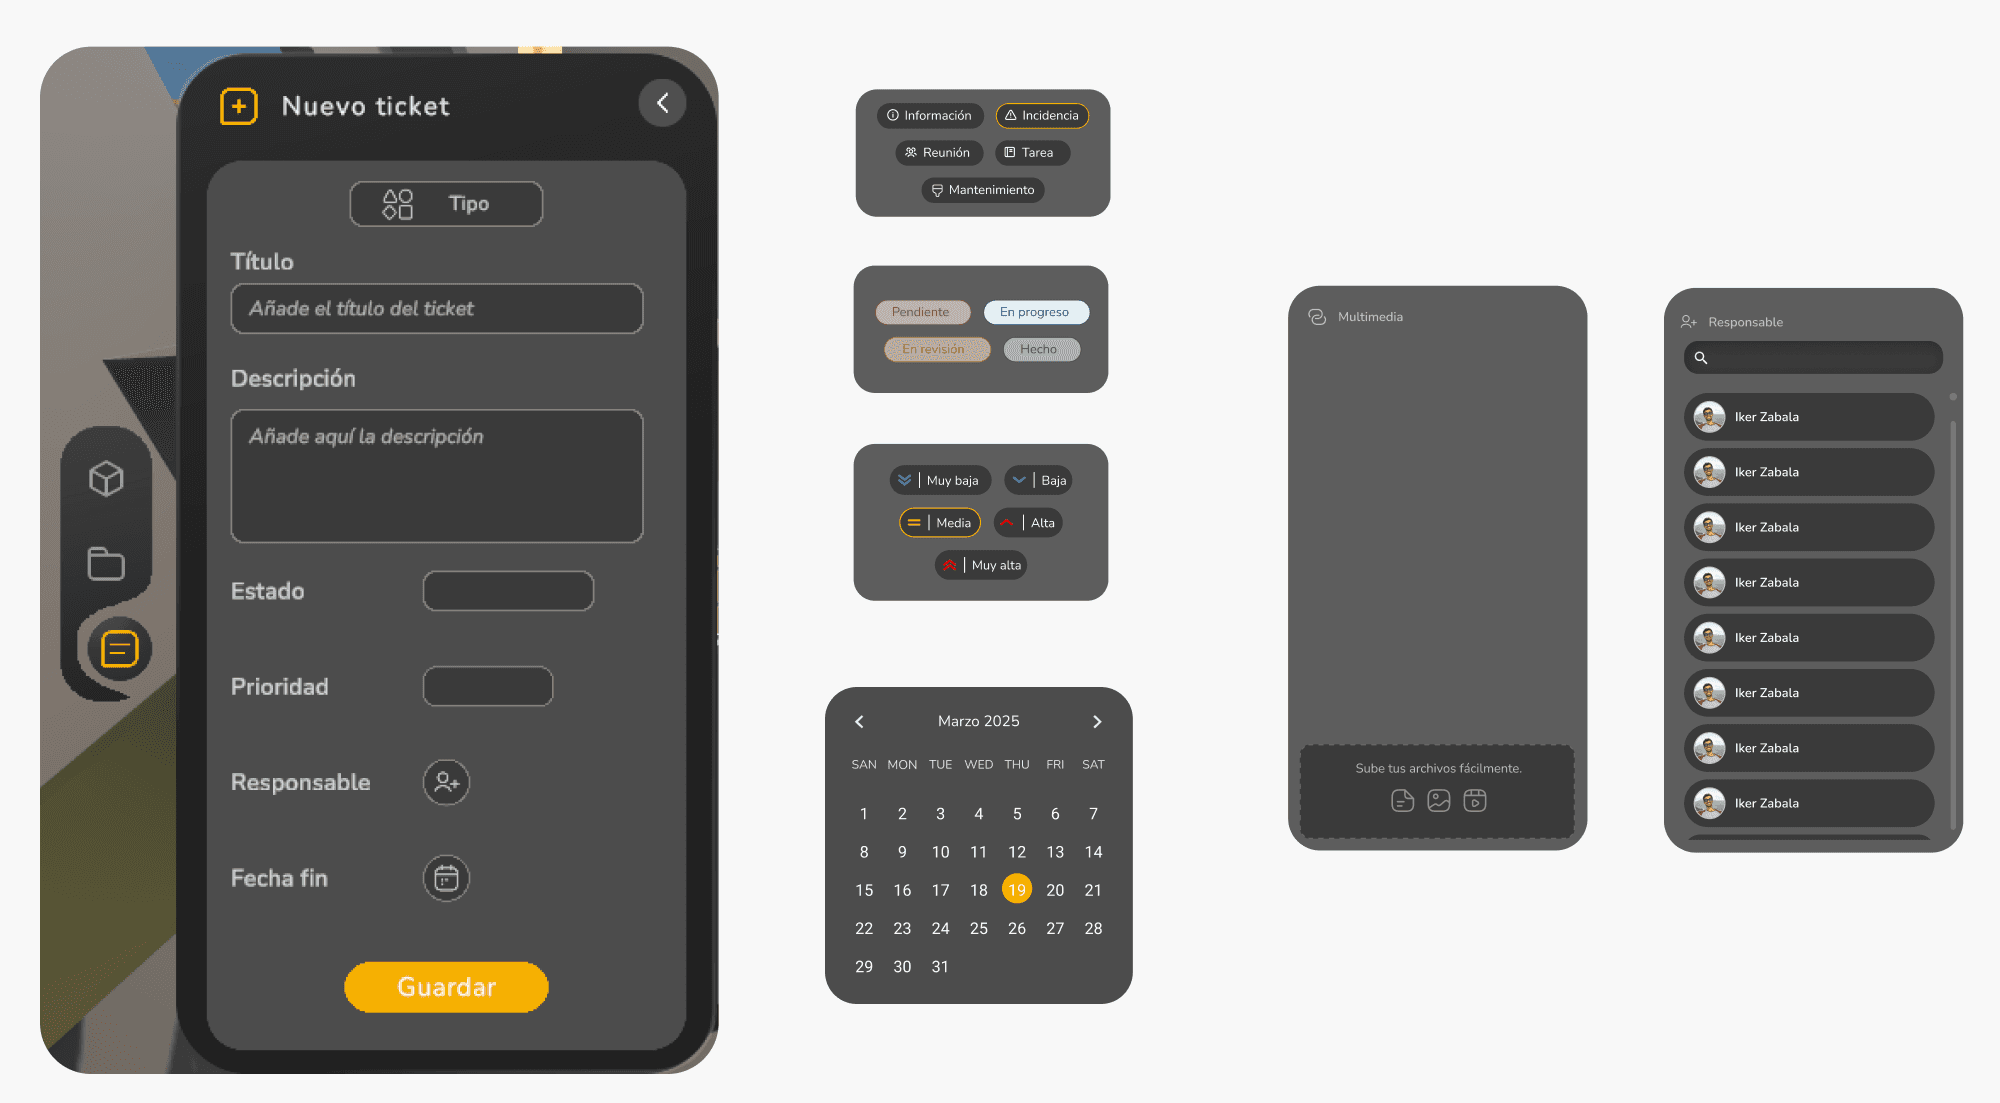
Rediseño de la interfaz de creación de tickets
Creación de tickets recibe un rediseño integral que introduce una interfaz moderna, clara y modular. Se incorporan nuevos componentes visuales —estados, prioridades, tipos, alarms, calendario, loader multimedia y selector de responsables— que optimizan el flujo de creación y edición de incidencias. Este rediseño aumenta la eficiencia operativa y mejora la comprensión visual, aportando coherencia estética con el nuevo lenguaje de TOKII.
Notificaciones y navegación
Cada notificación se asocia a su incidencia de origen y permite una navegación directa.
Optimización
Nuevas métricas en analytics para registrar tiempo de carga.
Actualización de eventos de analytics con nuevos parámetros.
Investigación y mejoras en optimización de carga del entorno 3D.
Limpieza general de logs.
Datasets, MQTT y listas
Baliza disponible también por Dataset.
Correcciones y mejoras en Balizas y Listas.
Unificación final de las dos listas tras el cambio de backend.
Añadido mensaje para listas vacías en Dataset/MQTT.
Correcciones de errores
En esta versión abordamos una extensa lista de incidencias que afectaban la consistencia visual, la interacción y el comportamiento de las visualizaciones y hotspots:
Visualizaciones
Solucionado el problema por el cual, tras añadir un nuevo interactivo, la lista del menú KPIs no se actualizaba hasta reiniciar.
Corregido el error donde la sección activa se deseleccionaba al hacer scroll.
Ajustada la leyenda del Heat Map que no se mostraba correctamente.
Reparado el fondo en KPIs de línea.
Resuelto el redimensionamiento incorrecto en gráficas agrupadas y apiladas por MQTT.
Eliminada la duplicidad de leyendas en gráficas Connected Dots por MQTT.
Arreglado el tooltip desaparecido en la sección de estado.
Corregidos problemas en listas enviadas por MQTT.
Fix en color de letra para valores.
Solucionado el hotfix de porcentaje múltiple.
Resuelto error en envío de label para líneas MQTT.
Hotspots e interactivos
Resuelto el error de baliza por MQTT y aplicados hotfixes adicionales en balizas y listas.
Solucionado que el KPI asociado a un hotspot se ocultaba al salir del configurador pero el hotspot permanecía clicado.
Corregido que los inputs de configuración no se restablecían correctamente.
Reparada la visibilidad de botones en el configurador de hotspots.
Arreglado el focus del hotspot, que se aplicaba sobre su KPI aun estando desactivado.
Solucionado reinicio inesperado del tamaño al entrar a configurar un hotspot.
Corregido que cancelar o restablecer no devolvía el valor previo de hotspotOnOff.
Reparado que no se pudiera configurar ancho/alto cuando el KPI estaba en modo hotspot.
Ajustes en el comportamiento del tamaño general de los hotspots.
Notificaciones, mapa y otros módulos
Corregido el resize del menú de notificaciones.
Resuelto el problema de cursor incorrecto sobre elementos interactivos.
Solucionado que al entrar en un site vacío apareciera incorrectamente el botón IFC.
Ajustado el tooltip en Connected Dots.
Añadido mensaje de dataset vacío en listas.
Limpieza y reparación del plugin del chatbox, que afectaba a la build.
Hotfix procesado CSV e InfoPanel.