


Success story
Primetals
Primetals Technologies is a company specializing in solutions, technologies, and services for the metallurgical industry. With an international presence and more than 70 years of accumulated experience in the sector, it drives innovation, digitalization, and sustainability in metal production processes.
Success story
Primetals
Primetals Technologies is a company specializing in solutions, technologies, and services for the metallurgical industry. With an international presence and more than 70 years of accumulated experience in the sector, it drives innovation, digitalization, and sustainability in metal production processes.
Success story
Primetals
Primetals Technologies is a company specializing in solutions, technologies, and services for the metallurgical industry. With an international presence and more than 70 years of accumulated experience in the sector, it drives innovation, digitalization, and sustainability in metal production processes.

SECTOR
Industria
AECO
Industria
AECO
DEVICE
PC App
TECHNOLOGIES
Artificial Intelligence
Data visualization
SECTOR
Industria
AECO
DEVICE
DEVICE
PC App
TECHNOLOGIES
TECHNOLOGIES
Artificial Intelligence
Data visualization
Context
The challenge
The objective of the project was to enable Primetals to understand the predictions and conclusions generated by their existing data simulator. By incorporating explainable AI, the aim was to provide a clearer and more detailed visualization of the results, offering transparency so that the results would inspire confidence and optimize plant efficiency.
The Primetals team faced contradictions regarding the predictions generated by their old simulation system, compared to their own deductions and expectations based on the current knowledge of the plant's status. The predictions did not match reality, and the team did not understand why the system generated those results. This problem hindered future decision-making, as, without a clear interpretation of the data, it was difficult to plan improvements.


The solution
TOKII, IMMERSIA's SaaS platform
1
3D digital inventory
Integration of the plant's digital twin for an accurate and navigable view of all assets
2
Real-time monitoring
Monitoring of operational and structural parameters + integration of data captured by drones and industrial systems
3
Incident Management
Collaborative workflow that allows configuring alarms, setting custom thresholds, and generating tickets with attached images, videos, and other multimedia files. To track and resolve incidents quickly.
Results
TOKII has consolidated a more efficient, proactive, and secure maintenance model.
Streamline the processes
of maintenance
Improve asset monitoring thanks to digital inventorying
Streamline the processes
of maintenance
Improve asset monitoring thanks to digital inventorying
Immersive 3D visualization
Mejorar la monitorización de activos gracias al inventariado digital
Context
The challenge
The objective of the project was to enable Primetals to understand the predictions and conclusions generated by their existing data simulator. By incorporating explainable AI, the aim was to provide a clearer and more detailed visualization of the results, offering transparency so that the results would inspire confidence and optimize plant efficiency.
The Primetals team faced contradictions regarding the predictions generated by their old simulation system, compared to their own deductions and expectations based on the current knowledge of the plant's status. The predictions did not match reality, and the team did not understand why the system generated those results. This problem hindered future decision-making, as, without a clear interpretation of the data, it was difficult to plan improvements.
The solution
TOKII, an interactive simulator to visualize and understand production data
TOKII, an interactive simulator to visualize and understand production data
1
Interactive data simulator
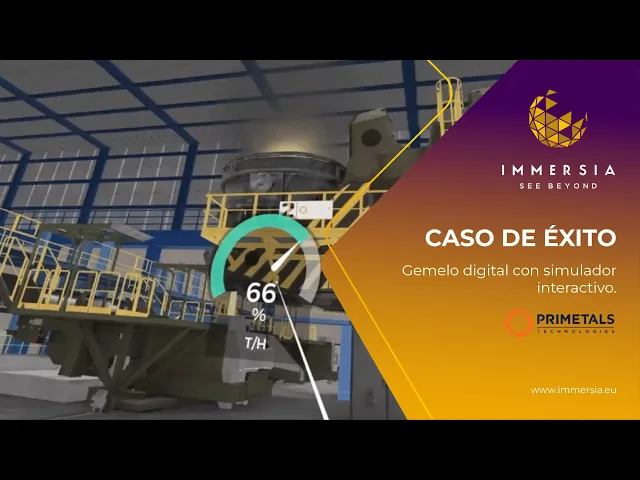
To address this challenge, the IMMERSIA team configured TOKII to develop an interactive data simulator that would offer a clear and detailed visualization of the data.
2
Process visualization and analysis
Using explainable AI through visual interfaces, the application allows users to interact with the data, track each stage of the process and go back in time to identify bottlenecks.
3
Reports and alerts
The application allows generating reports on critical moments and alerts in the manufacturing process, helping to clarify the process behind the predictions and improve the understanding of the results.
Results
A greater understanding of predictions to optimize processes
A greater understanding of predictions to optimize processes
Greater plant efficiency
The digital twin with explainable AI has improved the efficiency of the Primetals plant, facilitating the analysis and monitoring of processes.
More understandable predictions
TOKII's advanced visualization allows for a better understanding of the simulation engine's predictions and the reasoning behind the results obtained.
Detection and analysis of critical points
The solution facilitates the identification of bottlenecks, tracking the evolution of processes, and generating accurate reports with greater transparency and reliability.
Ready to turn your project into a success story?
Ready to turn your project into a success story?
Discover how TOKII can help you increase your effectiveness.
DISCOVER MORE SUCCESS STORIES


Cascajares
Cascajares


Comdiflex


Vicinay Marine