representación de entorno industrial del sector de la construcción con infraestructuras y edificios en construcción, grúas torre, y andamios

Digital Twin Platform for AECO

Digital Twin Platform for AECO

Monitoring a construction project with plans and spreadsheets is no longer enough. Today, the most effective teams work on 3D models with real-time data, using visual analytics and artificial intelligence to transform construction and the maintenance of infrastructures.

Monitoring a construction project with plans and spreadsheets is no longer enough. Today, the most effective teams work on 3D models with real-time data, using visual analytics and artificial intelligence to transform construction and the maintenance of infrastructures.

TOKII centralizes information from multiple sources and systems to help plan, analyze, and maintain infrastructure more efficiently, enabling precise and dynamic oversight that reduces errors and costs.

With TOKII, you can have complete visibility of operations, anticipate failures, detect bottlenecks, and reduce operating costs by visualizing your entire production chain on a single platform.

Integrating digital twins with real-time BIM attributes results in a 30% reduction in predictive maintenance activities.

Integrating digital twins with real-time BIM attributes results in a 30% reduction in predictive maintenance activities.

iBinder

Smart projects, informed decisions

Smart projects, informed decisions

Smart plug & play construction:

Smart plug & play construction:

Connect and control your project.

Connect and control your project.

Connect BIM, GIS, and IoT data

Connect BIM, GIS, and IoT data

Connect BIM, GIS, and IoT data

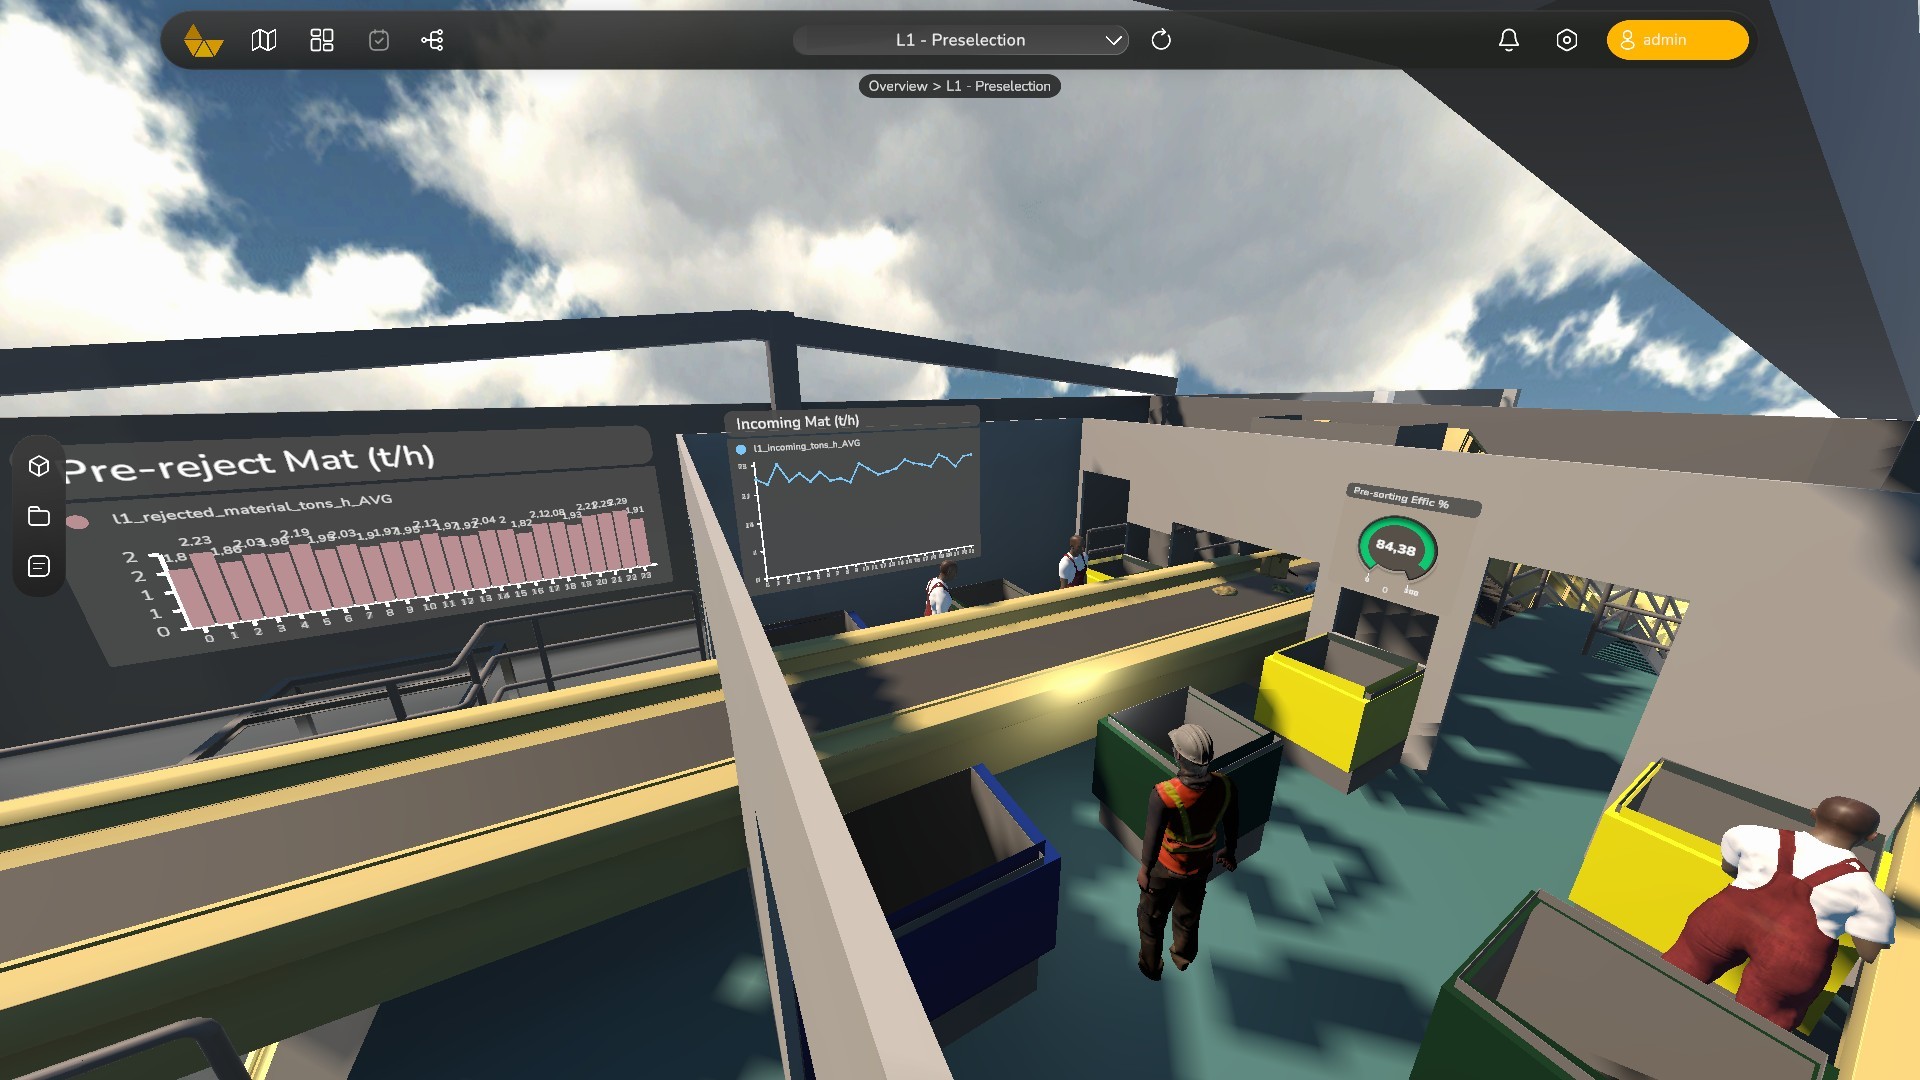
Integrate data from all your sources to streamline project management. It allows native connections to machinery, BMS or SCADA systems, and sensors installed on tower cranes, excavators, total stations, or smart elevators. Eliminate data silos and centralize all operational project information.

pantalla del panel de administración de tokii en el que se ve la conexión de datos via dataset y MQTT para integrar datos en la plataforma de gemelos digitales para su procesamiento
Representación de la librería de visualizaciones integrada en TOKII con múltiples gráficos, dashboards, y otras visualizaciones que se adaptan a los datos mediante clicks

Create KPIs for progress, cost, and emissions

Create KPIs for progress, cost, and emissions

Create KPIs for progress, cost, and emissions

Define key indicators such as energy consumption per building, CO₂ emissions, waste rates, and budget deviations to take precise action at each phase of the project.

Visualize your project in 3D and augmented reality

Visualize your project in 3D and augmented reality

Visualize your project in 3D and augmented reality

Visualize the real status of the project in its physical environment using augmented reality, from a mobile device or tablet. TOKII allows key information to be overlaid on the model, such as BIM attributes, tickets, tasks, and on-site data—geolocated with real coordinates to support decision-making in early phases like material stockpiling or mobilization.

Gemelo digital multidispositivo, con KPIs y gráficos relevantes sobre el entorno. Permite importar información BIM para una monitorización más eficiente de las infraestructuras.
Entorno inmersivo en 3D de la versión para ordenador, con gráficos de barras y líneas que habilita el seguimiento de consumo energético y desvio de presupuesto de la obra.

Analyze Project Execution by Phases

Analyze Project Execution by Phases

Analyze Project Execution by Phases

Detect deviations in planning, cost overruns, material delivery delays, or coordination issues between subcontractors. Visualize performance by construction phase or installation, and access productivity comparisons and efficiency ratios by site, project, or across multiple projects.

Manage inspections and maintenance

Manage inspections and maintenance

Manage inspections and maintenance

The platform facilitates multidisciplinary collaboration through a centralized repository of technical records and shared plans. Assign responsibilities and schedule reviews from the integrated calendar, along with descriptions and images, for efficient coordination between architecture, engineering, and construction teams.

Módulo de gestión de tickets, incidencias y tareas que permite añadir descripciones, asignar responsables, adjuntar archivos multimedia como fotos, y sincronizarlo al calendario.

Key Benefits of TOKII for AECO

Discover everything it can offer

Key Benefits of TOKII for AECO

Discover everything it can offer

Key Benefits of TOKII for AECO

Discover everything it can offer

Key Benefits of TOKII for AECO

Discover everything it can offer

-10%
-10%

In rework and redesigns

In rework and redesigns

thanks to the integration of BIM information and on-site alignment validation using AR.

thanks to the integration of BIM information and on-site alignment validation using AR.

-20%
-20%

In project delays

In project delays

thanks to real-time tracking of progress, resource availability, and construction material deliveries.

thanks to real-time tracking of progress, resource availability, and construction material deliveries.

+60%
+60%

In communication efficiency

In communication efficiency

Thanks to the centralization of documents, comments, and status notifications among contractors, engineers, and project managers.

Thanks to the centralization of documents, comments, and status notifications among contractors, engineers, and project managers.

-25%
-25%

In machinery maintenance costs

In machinery maintenance costs

Through real-time monitoring and early fault detection in equipment such as cranes, excavators, and lifting systems.

Through real-time monitoring and early fault detection in equipment such as cranes, excavators, and lifting systems.

Explore TOKII with our experts

Schedule a demo to discover how TOKII can adapt to your specific needs.

Because seeing how others use it always helps

Discover success stories in your sector

Fulcrum Logo

Success Case - FULCRUM

Fulcrum Logo

Success Case - FULCRUM

Fulcrum Logo

Success Case - FULCRUM

Fulcrum Logo

Success Case - FULCRUM

2D and 3D dashboards, bar charts, line charts, donut and circle charts with color codes.
Primetals Logo

Success Case – Primetals

2D and 3D dashboards, bar charts, line charts, donut and circle charts with color codes.
Primetals Logo

Success Case – Primetals

2D and 3D dashboards, bar charts, line charts, donut and circle charts with color codes.
Primetals Logo

Success Case – Primetals

2D and 3D dashboards, bar charts, line charts, donut and circle charts with color codes.
Primetals Logo

Success Case – Primetals

Acciona Logo

Success Case with Virtual Reality – Acciona

Acciona Logo

Success Case with Virtual Reality – Acciona

Acciona Logo

Success Case with Virtual Reality – Acciona

Acciona Logo

Success Case with Virtual Reality – Acciona