
Updated
Predictive analytics involves using historical data, statistics, and machine learning algorithms to identify patterns and determine what is likely to happen in the future.
Also known as predictive analytics, it transforms data generated by machines, systems, and assets into useful information that helps anticipate behaviors, detect anomalies early, and make evidence-based decisions.
Different predictive algorithms can be used for this purpose, and choosing the right one depends on the type of data and the outcome you want to obtain, such as predicting a category, estimating a numerical value, or forecasting how a variable will evolve over time.
Traditionally, developing these types of models required programming skills and specialized professionals. However, today’s no-code machine learning platforms make it possible to perform predictive analytics through visual interfaces, making this technology accessible to professionals in operations, maintenance, engineering, and innovation.
What is no-code machine learning?
No-code machine learning brings tasks that would normally require programming into a visual interface. Users can prepare data, define the problem, train models, and review their results without having to develop every step from scratch.
Machine learning enables systems to learn patterns from the data they collect. Instead of programming a specific rule for every possible situation, the model identifies relationships and patterns that it can later use to classify, estimate, or predict new cases.
This is especially useful in predictive analytics, where large volumes of information from sensors, machines, or operational processes may be involved. In addition, the no-code approach simplifies the technical side of the process by making tasks such as data preparation, algorithm selection, model training, and evaluation easier through a visual interface. This allows professionals who understand the processes firsthand, whether they work in operations, maintenance, engineering, or innovation to participate directly in data analytics projects.
This approach is particularly valuable in industries that generate large volumes of dara, including:
How to Perform Predictive Analytics with a No-Code ML Platform
No-code machine learning platforms bring different tasks that traditionally required programming into a visual interface, including data preparation, model configuration, and results analysis. Instead of manually developing the entire machine learning workflow, users can follow a guided process from configuring data sources to generating predictions.
With platforms such as TOKII, the process can be summarized in the following steps:
Data source configuration
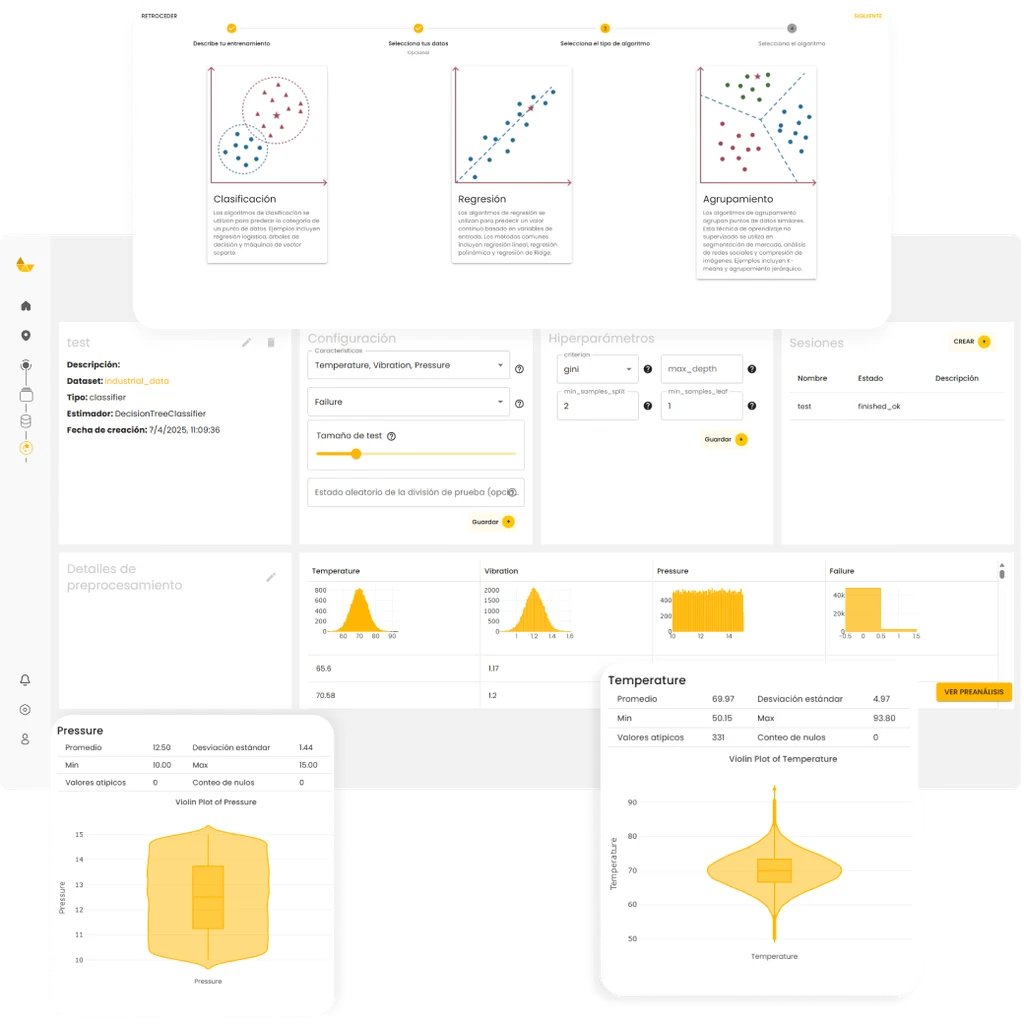
The first step is to select the data that will be used to train the model. This data can come from sensors, assets, systems, or datasets such as XLS and CSV files. Before training, the data can be reviewed and prepared to ensure it is in the appropriate format.
Problem definition
Machine learning can address different types of problems. Depending on the objective, users can work with:
Classification, when the goal is to predict a category or state.
Regression, when the goal is to estimate a numerical value.
Clustering, when the goal is to discover groups or similar patterns.
Time series, when the goal is to predict how a variable will evolve over time.
Algorithm selection
Once the problem has been defined, TOKII displays the machine learning algorithms that are compatible with that choice so the user can select the most appropriate one.
For example, classification problems can use algorithms such as decision trees or Random Forest; clustering can use options such as K-Means; and Prophet can be used for time series, among others. This way, algorithm selection is guided by the type of analysis being performed, without requiring users to know all the available alternatives beforehand.
Model configuration
The user defines the variables that will be included in the training process and, when applicable, the variable to be predicted. They can also configure aspects such as the dataset used to evaluate the model and certain parameters specific to the selected algorithm.
Model training and comparison
Once the model has been configured, training begins. Different sessions can be created using different configurations or algorithms to compare the results and analyze which model performs best with the available data.
Results evaluation
After training, the model’s performance is evaluated using metrics suited to the type of problem. For example, classification can use metrics such as accuracy, recall, or F1, while regression can be evaluated using indicators such as MAE, RMSE, or R².
These metrics help users understand how the model behaves, assess its performance, and identify potential limitations before applying it to new data. They also provide greater transparency into the evaluation process and make the model’s results easier to interpret.
Prediction generation
Once trained and validated, the model can be reused to generate new predictions whenever needed by applying it to new data without having to rebuild it. This makes it possible, for example, to estimate new consumption levels, classify new operating states, or anticipate how a variable may evolve as additional data becomes available.
Predictions can then be incorporated into dashboards and 3D environments to make them easier to visualize and use as support for analysis and decision-making.
In this way, a no-code predictive analytics platform allows users to move through the entire process, from data to predictions, without having to manually develop each stage through programming.
Benefits of no-code ML platforms
For many organizations, one of the main barriers to applying machine learning is not the lack of data, but the technical complexity involved in turning that data into useful models.
No-code platforms reduce this barrier by simplifying the different stages of the process and allowing professionals with business or operational knowledge to work directly with the data.
Some of the main benefits include:
1. Faster implementation: Visual tools for preparing data, configuring models, and launching training sessions reduce the manual work required to develop an initial model.
2. Lower technical barrier: There is no need to program the entire machine learning workflow from scratch, making it easier for other professionals to participate in the process alongside data specialists.
3. Easier experimentation: Users can test different algorithms and configurations, compare their results, and iterate on models more efficiently.
4. Scalability: Once a use case has been defined, the same approach can later be applied to other assets, facilities, plants, or datasets.
5. Integration with operations: Model results can be incorporated into dashboards and monitoring environments and analyzed alongside operational data.
6. Better use of existing data: Organizations can use historical data from sensors, systems, and assets to obtain additional insights instead of limiting themselves to simply visualizing what is happening at a given moment.
For companies, this can translate into less downtime, better resource allocation, and greater competitiveness.
With platforms like TOKII, industrial teams can build, train, and deploy machine learning models in just a few clicks, turning data into real-time decisions without writing code.
Want to explore predictive analytics but don’t know where to start? Request a DEMO of TOKII and let our team of experts guide you step by step.